The 2 main violation detection methods are radar and buried road sensors. When a violation is detected a camera takes a photo of the violation. Many systems also record video.
Radar
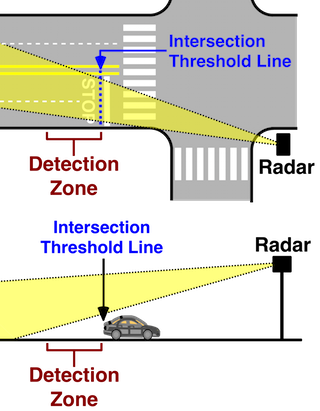
A pole mounted radar aims a narrow beam that covers the vehicle detection zone. The beam is adjusted for the intersection violation line. The beam must be set to very tight tolerances. At least one red light camera manufacturer (Redflex) has used radar.
Video Based
These systems are often used in conjunction with other sensors.

Buried Road Sensors
There are 3 types of buried road sensors.
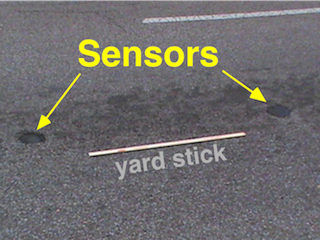
Magneto Resistive Sensors
|
Magneto resistive sensors are also used to measure highway traffic speeds and vehicle length. The sensors are typically spaced 10 to 20 feet apart in this application.